🔬 Cell Morphology Analyzer
Computer Vision Cell Segmentation, Image Quality Diagnostics & Rule-Based Morphological Classification
⚠️
Scientific Disclaimer: This analysis is exploratory and does not determine tissue health or clinical diagnosis.
📁 Microscopy Image Upload & Input Stream
Formats: PNG, JPG, JPEG, TIFFAnalysis ID: --
Profile: --
Image Source: --
Uploaded File: --
SHA256 Hash:
--
SEGMENTATION STATUS
🟢 Completed
Pipeline Execution: Success
INTERPRETATION CONFIDENCE
🟡 Low
Exploratory Results
SEGMENTED CANDIDATE STRUCTURES
--
Candidate Regions
MEAN CIRCULARITY
--
(4π × Area) / Perimeter²
IMAGE SHARPNESS
--
Laplacian Variance
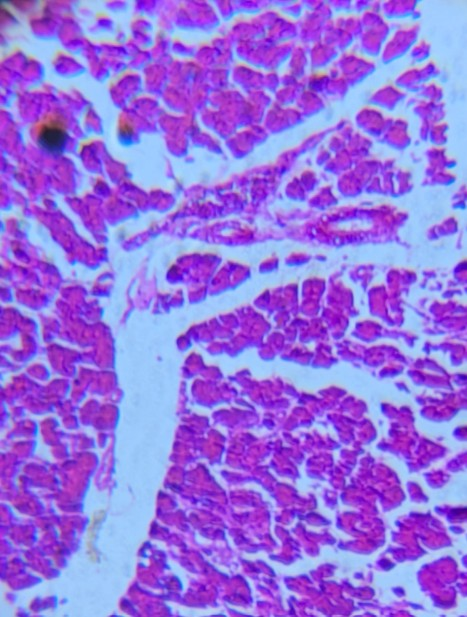
🖼️ Original Input Microscopy Image
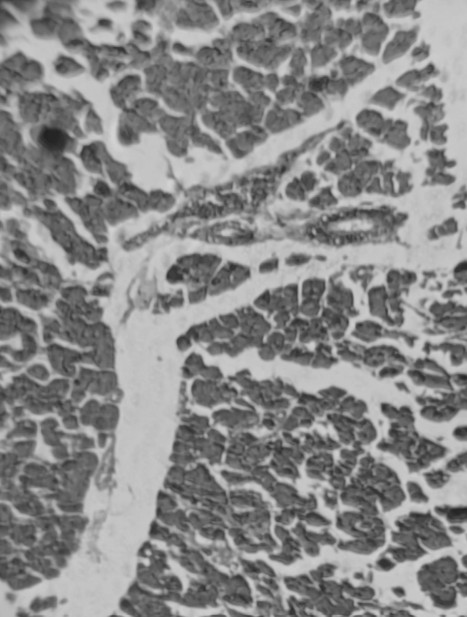
☯️ Intensity Grayscale Conversion
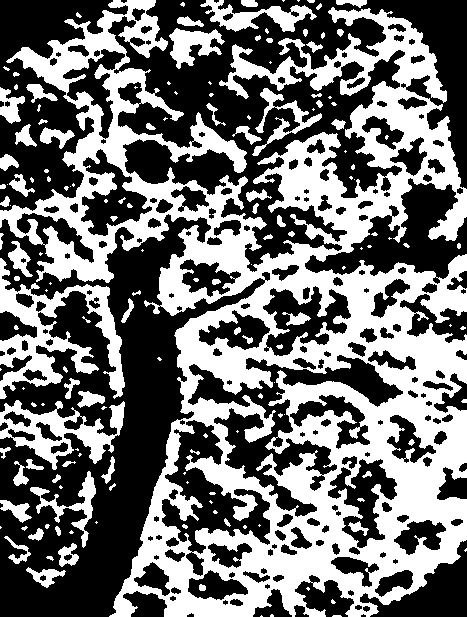
🔲 Otsu Binary Thresholding & Closing
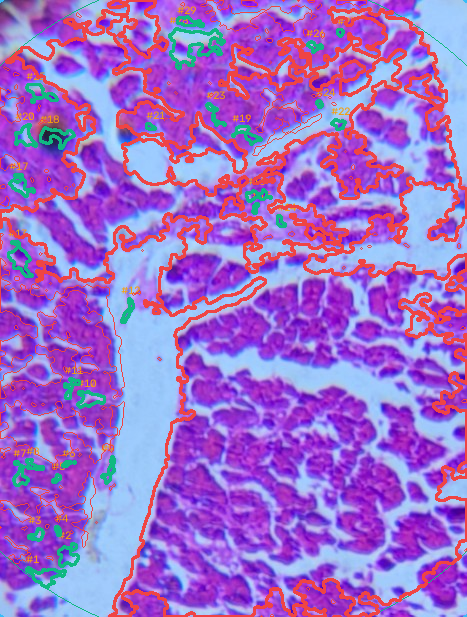
🟢 Segmented Region Overlay
📸 Image Quality & Processing Diagnostics
| Image Dimensions | -- |
| Mean Brightness (0-255) | -- |
| Contrast (Pixel Std Dev) | -- |
| Sharpness (Laplacian Var) | -- |
| Noise Estimate (Residual Std) | -- |
| FOV Coverage Area | -- |
| Raw vs Accepted Contours | -- |
| Relative Candidate Area % | -- |
📏 Morphometric Summary
| Mean Region Area | -- |
| Mean Region Perimeter | -- |
| Mean Circularity (0-1) | -- |
| Mean Aspect Ratio (W/H) | -- |
| Mean Solidity (Area/Hull) | -- |
📊 Segmented Individual Cell Measurements
Per-Cell Contours| Cell ID | Area (px²) | Perimeter (px) | Circularity | Aspect Ratio | Solidity |
|---|---|---|---|---|---|
| Loading individual cell measurements... | |||||